this curve implicitly. I don't get much insight from this.
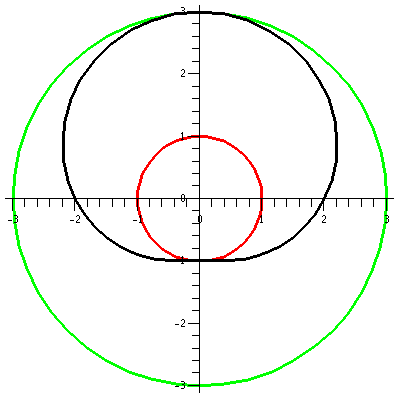
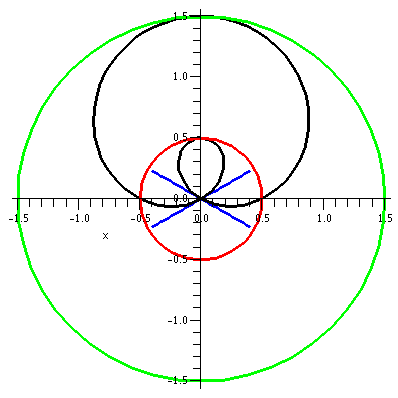
r=2+sin(θ)
Now consider r=2+sin(θ). Again,
the values of sine are all between -1 and 1, so r will be between 1
and 3. Any points on this curve will have distance to the origin
between 1 and 3. We can begin (?) the curve at θ=0 when r=2, and spin around
counterclockwise. The distance to the origin increases to r=3 at θ=Pi/2 (the positive y-axis). The
distance to the origin decreases back to r=2 when θ=Pi (the negative x-axis). The
curve gets closest to the origin when θ=3Pi/2 (the negative y-axis) when r=1. Finally, r increases
(as θ increases in the
counterclockwise fashion) to r=3 again when θ=2Pi.
Here the "deviation" from circularity in the curve is certainly
visible. The bottom seems especially dented.
| 
|
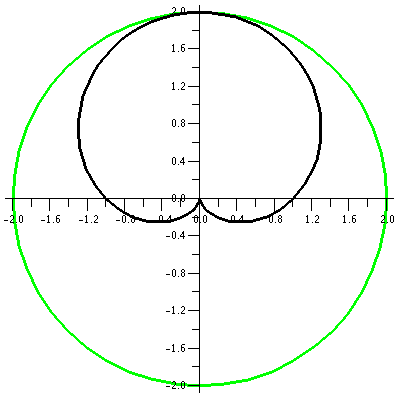
r=1+sin(θ)
We decrease the constant a bit more, and look at r=1+sin(θ). The values of sine are all
between -1 and 1, so r will be between 0 and 2. The (red) inner circle
has shrunk to a point. This curve will be inside a circle of radius 2
centered at the origin. We begin our sweep of the curve at 0, when r
is 1. Then r increases to 2, and the curve goes through the point
(0,2). In the θ interval from
Pi/2 to Pi, sin(θ) decreases
from 1 to 0, and the curves moves closer to the origin as r decreases
from 2 to 1. Something rather interesting now happens as θ travels from Pi to 3Pi/2 and then
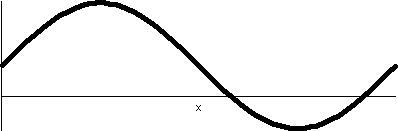
from 3Pi/2 to 2Pi. 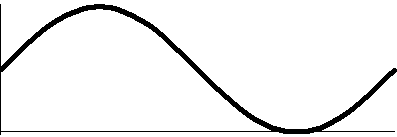 The rectangular graph of 1+sine, shown here, decreases
down to 0 and then increases to +1. The polar graph dips to 0 and then
goes back up to 1. The dip to 0 in polar form is geometrically a sharp
point! I used "!" here because I don't believe this behavior is easily
anticipated. The technical name for the behavior when r=3Pi/2 is
cusp. The rectangular graph of 1+sine, shown here, decreases
down to 0 and then increases to +1. The polar graph dips to 0 and then
goes back up to 1. The dip to 0 in polar form is geometrically a sharp
point! I used "!" here because I don't believe this behavior is easily
anticipated. The technical name for the behavior when r=3Pi/2 is
cusp.
This curve is called a cardioid from the Latin for "heart"
because if it is turned upside down, and if you squint a bit, maybe it
sort of looks like the symbolic representation of a heart. Maybe.
| 
|
r=1/2+sin(θ)
Let's consider r=1/2+sin(θ). The values of sine are all
between -1 and 1, so r will be between -1/2 and 3/2. The (red) inner
circle actually had "radius" -1/2, and it consists, of course, of
points whose distance to the pole, (0,0), is 1/2. When θ is 0, r is 1/2. In the first two
quadrants, 1/2+sin(θ) increases
from 1/2 to 3/2 and then backs down to 1/2. In the second two
quadrants, when θ is between Pi
and 2Pi, more interesting things happen.
 The rectangular graph on the interval [0,2Pi] of sine moved up by 1/2
shows that this function is 0 at two values, and is negative between
two values. The values are where 1/2+sin(θ)=0 or sin(θ)=-1/2. The values of θ satisfying that equation in the
interval of interest are Pi+Pi/6 and 2Pi-Pi/6. The curves goes down to
0 distance from the origin at Pi+Pi/6, and then r is negative until
2Pi-Pi/6. The natural continuation of the curve does allow negative
r's, and the curve moves "behind" the pole, making a little loop
inside the big loop. Finally, at 2Pi-Pi/6, the values of r become
positive, and the curve links up to the start of the big loop.
The rectangular graph on the interval [0,2Pi] of sine moved up by 1/2
shows that this function is 0 at two values, and is negative between
two values. The values are where 1/2+sin(θ)=0 or sin(θ)=-1/2. The values of θ satisfying that equation in the
interval of interest are Pi+Pi/6 and 2Pi-Pi/6. The curves goes down to
0 distance from the origin at Pi+Pi/6, and then r is negative until
2Pi-Pi/6. The natural continuation of the curve does allow negative
r's, and the curve moves "behind" the pole, making a little loop
inside the big loop. Finally, at 2Pi-Pi/6, the values of r become
positive, and the curve links up to the start of the big loop.
This curve is called a limacon. The blue lines are lines with
θ=Pi+Pi/2 and θ=2Pi-Pi/6. These lines, for the θ
values which cross the pole, are actually tangent to the curve at the
crossing points.
| 
|
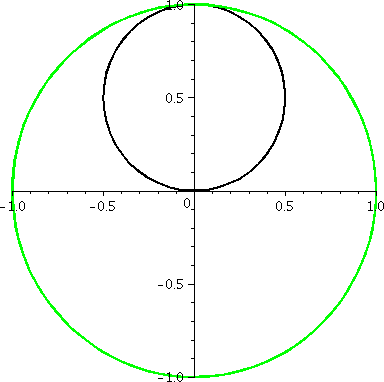
r=0+sin(θ)
Let's try a last curve in this family, with the constant equal to
0. What does r=sin(θ) look like? A graph is shown to the right.
There are several interesting features of this graph. First, this is a
polar curve which does have a nice rectangular (xy) description. If we
multiply r=sin(θ) by r, we get
r2=r·sin(θ), so that
x2+y2=y. This is x2+y2-y=0
or, completing the square,
x2+y2-2(1/2)y+(1/2)2-(1/2)2=0
so that (x-0)2+(y-1/2)2=(1/2)2. This
is a circle of radius 1/2 and center (0,1/2), exactly as it looks.
The moving "picture" of this curve is quite different. Between
0 and π it spins once around the circle but then from π to 2π
it goes around the circle another time! So this is really somehow two
circles, even though it looks like only one geometrically.
| 
|
More information about these curves is available here
Length of polar curves
The formula is
∫θ=αθ=βsqrt(r2+(dr/dθ)2)dθ. I used this to find the length of the
cardioid above (the double angle formula from trig is needed). Then I
used it to find the length of a circle (!), but here the novelty is
that we actually trace the circle r=cos(θ) twice from 0
to 2π, so some care is needed if we only wanted to find the length
of one circumference.
"Sketching" roses
Here are dynamic pictures of two roses. The first is the one I
sketched in class r=cos(3θ). It is covered twice and has 3
"petals". The second is r=cos(4θ). It is only covered once, and
it has 8 petals! Wow, polar coordinates can be annoying!
r=cos(3 )
This is a three-leafed rose. Please note that the graph shows one
sweep, as θ goes from 0 to 2Pi. )
This is a three-leafed rose. Please note that the graph shows one
sweep, as θ goes from 0 to 2Pi. 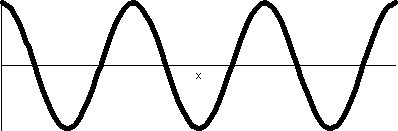 The
rectangular graph, shown here, has three pairs of ups and downs. The
polar trace covers the leaves twice. The six up-and-downs of
cos(3θ) (magically?) reduce to retracings of half of the
loops. I hope I made this evident. I introduced
some deliberate distortion in the second tracing. (!) Without
the distortion, the second tracing could not be seen at all, since the
pixels the "point" travels over and colors all had already been
colored. The
rectangular graph, shown here, has three pairs of ups and downs. The
polar trace covers the leaves twice. The six up-and-downs of
cos(3θ) (magically?) reduce to retracings of half of the
loops. I hope I made this evident. I introduced
some deliberate distortion in the second tracing. (!) Without
the distortion, the second tracing could not be seen at all, since the
pixels the "point" travels over and colors all had already been
colored.
| 
|
r=cos(4θ)
This "rose" has 8 leaves or petals, and
the dynamic way it is traced is weird and wonderful to me. 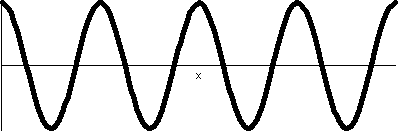 The rectangular
graph. to the right, shows four bumps up and four bumps down. There
are no retracings of already colored points, so that the wiggles up
and down of cos(4θ) all result in 8 leaves. The rectangular
graph. to the right, shows four bumps up and four bumps down. There
are no retracings of already colored points, so that the wiggles up
and down of cos(4θ) all result in 8 leaves.
| 
|
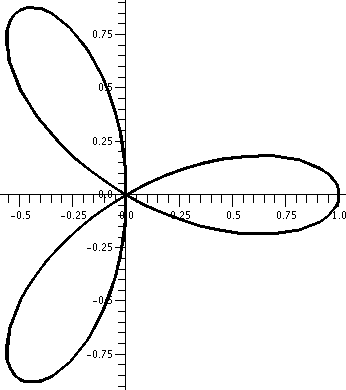 Area inside one petal of r=cos(3θ)
Well, cos(3θ) "first" (going from 0 to 2π) is 0 when
3θ=π/2. So we get half a petal by integrating from 0 to
π/6. The formula is
∫αβ(1/2)r2dθ so
this becomes (for the whole petal, we need to double):
2·(1/2)∫0π/6
cos(3θ)2dθ. We computed this using a trig
identity.
r=cos(3θ). Area inside one petal?
I didn't talk about Exponentials and snails, darn it!
http://en.wikipedia.org/wiki/Logarithmic_spiral
snail_spiral.gif from -Π to -5Π for r=e.25θ